Project Overview dashboard
Dashboard in the sidebar gives you one project's state on a single screen. Everything on it is built from the records in Execution — this is the read-and-decide view.
Use Refresh (top right) to force an immediate re-fetch.
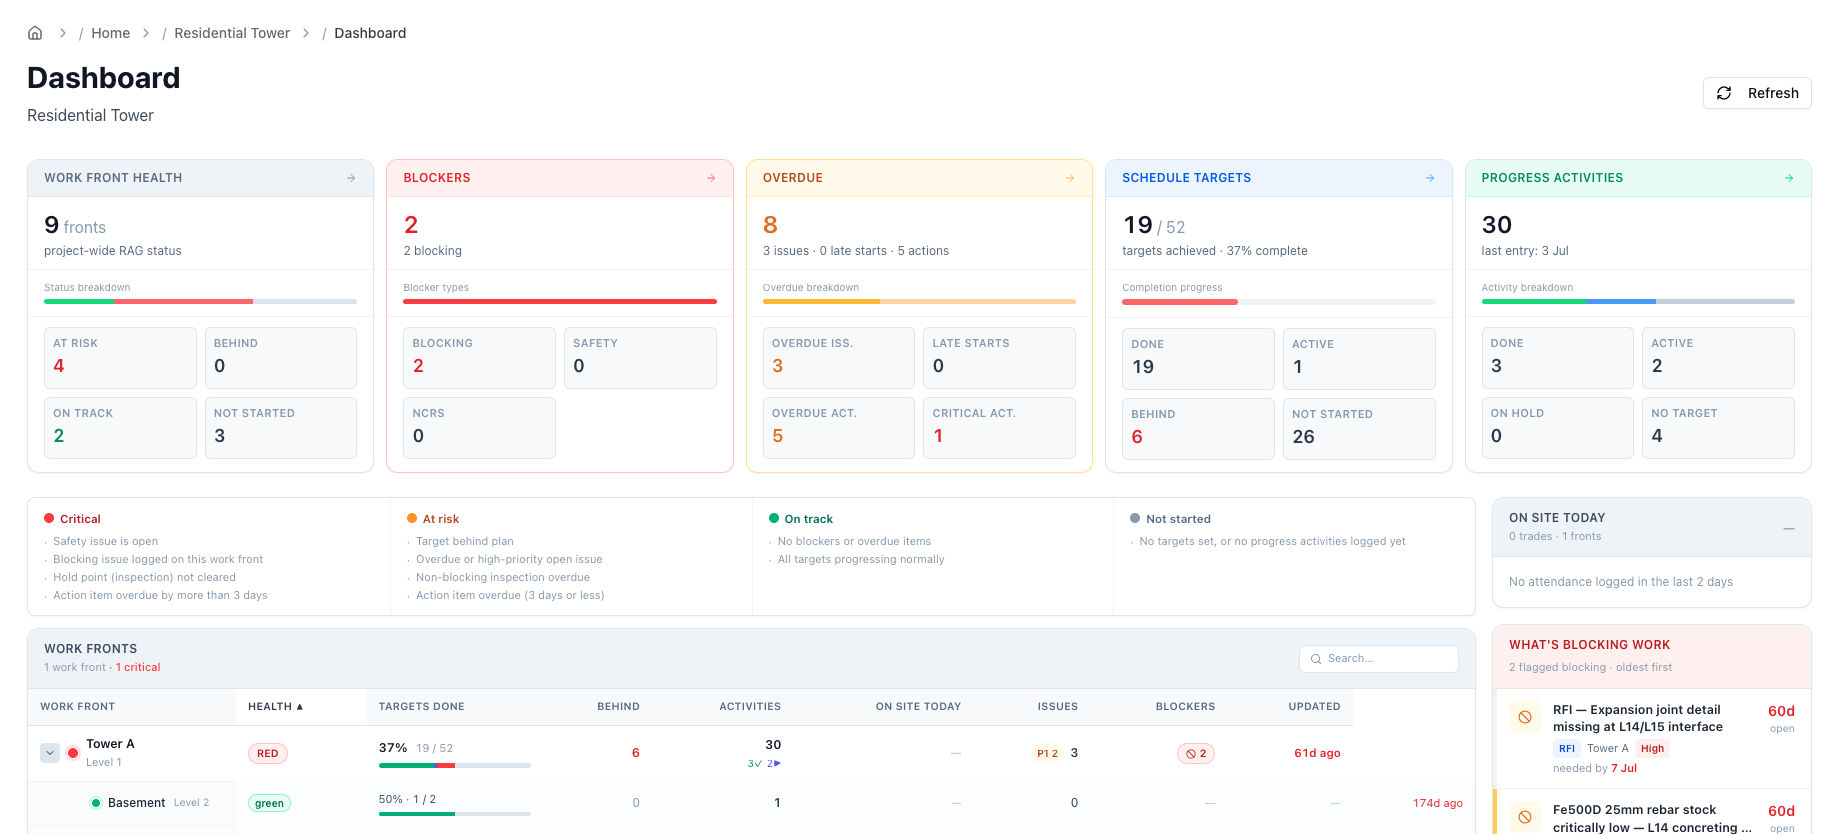
KPI band
Five cards across the top. Each shows a headline number, a breakdown bar, and a small grid of counts. Clicking a number opens a drill-down; clicking a card header jumps to the matching section or tab.
| Card | Headline | Breakdown |
|---|---|---|
| Work Front Health | Total work fronts | On track / Behind / At risk / Not started |
| Blockers | Items stopping work now | Blocking issues / Safety / NCRs |
| Overdue | Overdue items + late starts | Overdue issues / Late starts / Overdue actions / Critical actions |
| Schedule Targets | Targets achieved / total, % complete | Done / Active / Behind / Not started |
| Progress Activities | Total activities logged, date of last entry | Done / Active / On hold / No target |
Work front health
The same expandable RAG table as Execution's Work Fronts tab, with a legend above it.
- Expand a row to drill through the location levels.
- Click a work-front name for the drill-down panel: completion %, open issues, inspections, action items, sub-level breakdown, and workforce mix.
On site today
Headcount for the day with a breakdown by trade, and the change vs. yesterday.
If today's attendance hasn't been logged yet, the card shows yesterday's numbers and says so.
Blockers
Open blocking issues, oldest first, each with its age, work front, priority, and need-by date. Click one to see the WhatsApp messages behind it.
Activity feed
A rolling list of what's happened on the project — progress entries, issues, action items, and inspections.
- Scope it to Today, 7 days, or 30 days.
- Filter by type, or show All.
- Click any event to open its source messages.
What's next
- Portfolio Overview dashboard → — the same idea across every project
- Reports →